
Latest USS proposal: Who would lose most?
Yesterday (March 12th) the UUK/UCU negotiations at ACAS concluded with an agreement document.
In this post I’ll look at the numbers in those proposed interim changes to the Universities Superannuation Scheme, to work out how much money would effectively be lost by USS members at each salary level.
This is inevitably a fairly rough calculation, but its results don’t really demand more precision. The picture is very clear: the cost of “saving” USS would be felt most by USS members with low or moderate incomes.
The effective marginal rates at which money is lost by members are (as calculated below):
- 4.7% on salary up to £42k
- 6.3% on salary between £42k and the current USS threshold salary of £55.55k
- 1.0% (at most) on salary over £55.55k
This translates into the following relationship between salary and the percentage of total salary lost:
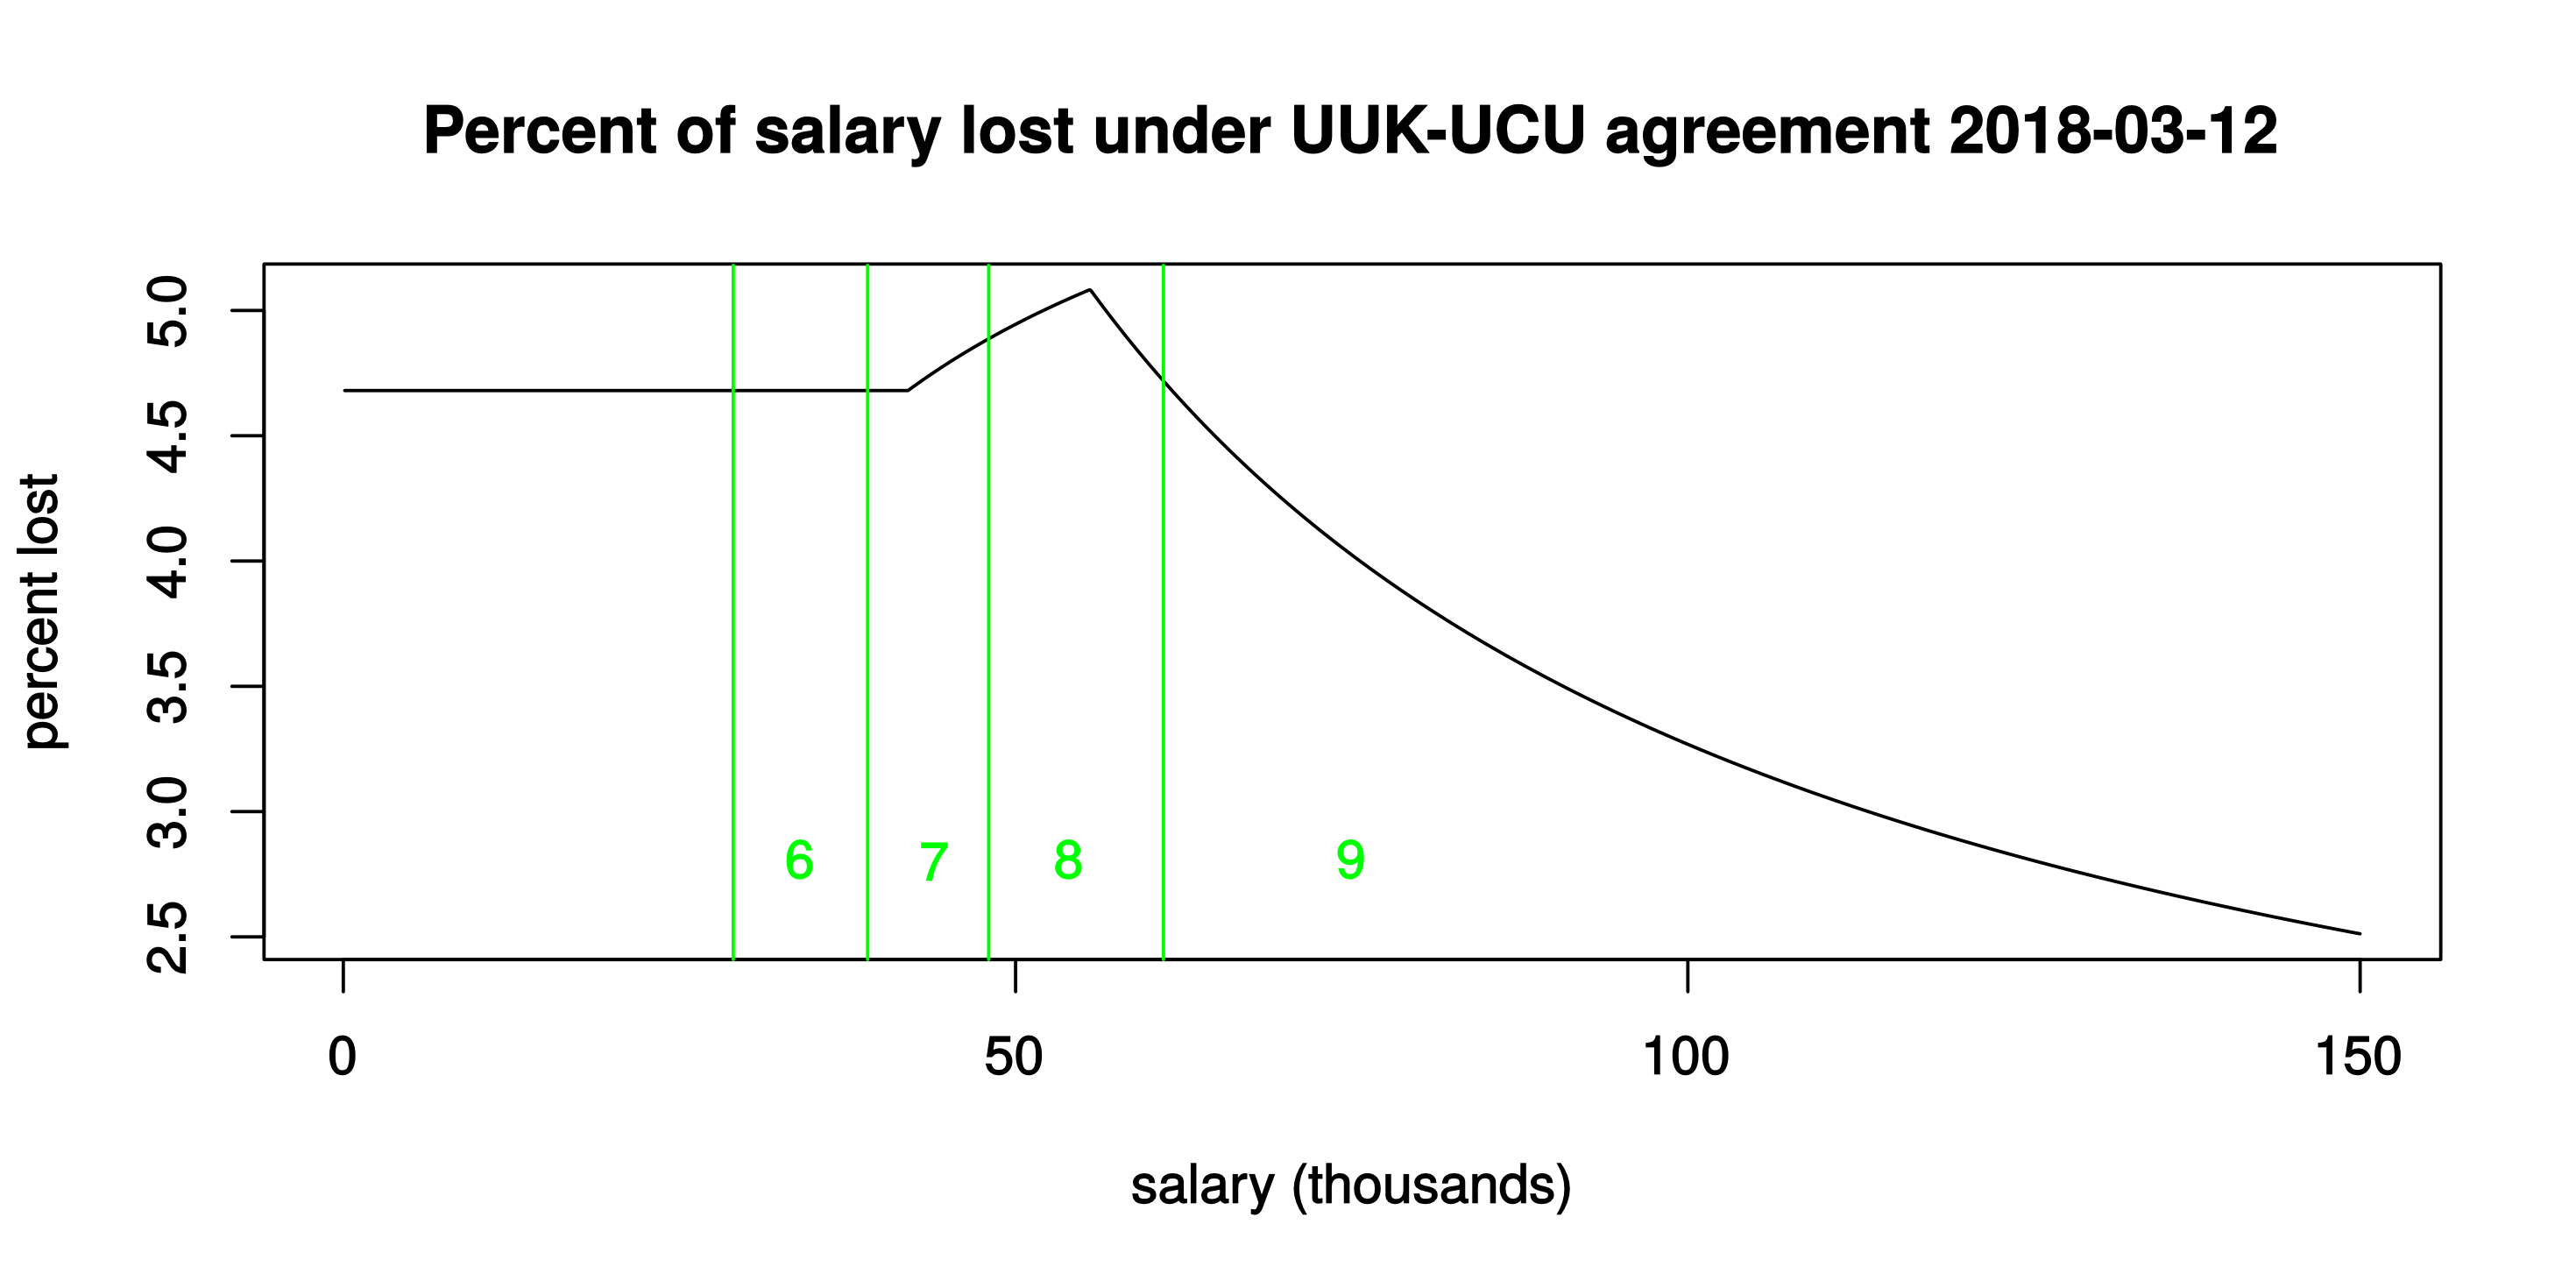
The two “kinks” in that graph reflect the discontinuities in marginal rates, at £42k and at £55.55k.
The vertical lines drawn in green are current full-time pay grades at a typical university (with no London allowance or other extras): grade 6 is the pay of many Research Associates and Teaching Fellows, for example; grade 7 is the pay of most Lecturers; grade 8 is the pay of Senior Lecturers and Readers; and grade 9 is the pay of Professors and other senior staff. (I have mentioned only academic and research staff here, but the same grades apply also to administrative and technical staff in UK universities.)
The long decay to the right continues indefinitely, ultimately approaching an asymptote at 1% lost, i.e., for those with absolutely stratospheric salaries (if such people are actually members of USS, still, that is — though I would guess that many are not).
In the rest of this post I’ll give the details of the calculation that leads to the above numbers and graph. (For people who prefer a list of numbers to a graphical display, I have also added the numbers as an Appendix at the bottom of this post.)
Just here, though, let me again comment on how unfair this “remedy” would be. The unfairness should be obvious from the above graph: those who are paid most, and would stand to benefit most from being in USS, would contribute least, in percentage terms, in this proposed move towards the future sustainability of USS. For a more general view on this unfairness, see also my previous two posts in this “USS” category:
The calculation
It suffices to consider salaries in three distinct bands. In each salary band, we can calculate how much is lost, per unit of salary.
The following code in R reproduces the graph drawn above. A brief explanation is then given, beneath the displayed code.
## This code runs in base R.

## Function to compute the amount that would be lost annually (£k)
## at any given salary level
sacrifice <- function(salary) { # salary in thousands
    old_threshold <- 55.55
    new_threshold <- 42
    s <- salary

## sacrifice arising from income up to the new threshold
    r1 <- min(s, new_threshold) * ((8.7 - 8)/100 +
                                    19 * (1/75 - 1/85) +
                                    1/100)

## sacrifice arising from income between the thresholds
    s2 <- (s > new_threshold) * (min(s, old_threshold) -
                                            new_threshold)
    r2 <- s2 * ((8.7 - 8)/100 + (19/75 - (12 + 8.7)/100) + 1/100)

## sacrifice (max) arising from income over the old threshold
    r3 <- (s > old_threshold) * (s - old_threshold) * (1/100)

    return(r1 + r2 + r3)
}

## A vector of salary values up to £150k
salaries <- (1:1500) / 10

## Compute percent of salary that would be lost,
## at each salary level
sacrifices <- 100 * sapply(salaries, sacrifice) / salaries

## Plot the result
svg(file = "lost.svg", width = 8, height = 4)
plot(salaries, sacrifices, type = "l",
 xlab = "salary (thousands)", ylab = "percent lost",
 main = "Percent of salary lost under UUK-UCU agreement 2018-03-12")
abline(v = c(29, 39, 48, 61), col = "green")
text(x = c(34, 44, 54, 75), y = 2.8,
 labels = c("6", "7", "8", "9"), col = "green")
dev.off()
Band 1: Salary up to £42k
Most contributions from this part of salary go to the “defined benefit” part of USS. The new proposal would see 8.7% of member’s salary up to £42k going in to this, as opposed to 8.0% at present. The return (i.e., the value of the defined-benefit pension) can readily be calculated using the standard HMRC formula, the one that is used for Annual Allowance purposes. Under current USS, the value of this part is 19 times (s/75), where s is either £42k or the member’s salary if the salary is less than £42k. Under yesterday’s proposals, the value of this part would fall to 19 times (s/85). Under yesterday’s proposals, USS members would also lose the possibility to add 1% “matching” employer contribution to an additional, defined-contribution pension pot. The amount lost to each member, relating to salary in this first band, is then the sum of the additional contribution made and the amount of pension value lost: that is r1 in the above code.
Band 2: Salary between £42k and £55.55k
Now, for salaries greater than £42k, let s2 be the smaller of (salary minus £42k) and (£55.55k minus £42k). Then current USS has members contributing 8% of s2 in the defined-benefit part, for a return of 19 times s2/75. Yesterday’s proposal would change the contribution to 8.7% of s2, for a return of s2 times (12% + 8.7%). And again, the possibility of 1% matching employer contribution to the defined-contribution pot would be lost. The amount lost to each member, relating to salary in this second band, is again just the sum of the additional contribution made and the amount of pension value lost: that is r2 in the above code.
Band 3: Salary over £55.55k
Relating to salary above the current £55.55k threshold, the loss would be limited to loss of the 1% matching employer contribution. This is computed as r3 in the above code. (In practice this will be an upper bound on what is lost. Those USS members with the very highest salaries are likely also to face issues relating to the HMRC Annual Allowance and Lifetime Allowance limits, in which case the loss of the matching employer contribution could be worth substantially less than 1% to them.)
Conclusion
I have reproduced the full calculation here, with code, because I found the result of the calculation so shocking! If anyone reading this thinks I have made a mistake in the calculation, please do let me know. If it is correct — and right now I have no reason to suspect otherwise — then I confess I’m alarmed that this is actually being proposed as a potential solution, even as an interim solution for the next 3 years, to the perceived problems with USS. It shakes my faith in those who have been involved in negotiating it. With seemingly intelligent people on both sides of the table, how could they possibly come up with something as bad as this?
Update, 14 March: Some details in the original post yesterday were not quite right, and so the graph/numbers that appear in the now-corrected version above are different in detail from yesterday’s. But the overall picture is unchanged. (If you really want to know about those changes in detail, please see my note in Appendix 2 at the bottom of the post about that.)
Update, 16 March: After reading this post, you might perhaps be interested in these follow-ups:
© David Firth, March 2018
To cite this entry: Firth, D (2018). Latest USS proposal: Who would lose most? Weblog entry at URL https://DavidFirth.github.io/blog/2018/03/13/latest-uss-proposal-who-would-lose-most/.
Appendix 1: A tabular view of what’s in the graph
## Make a table for anyone who wants more detail than the graph
salary <- c(10:55, 55.55, 56:100, 150)
percent_lost <- round(100 * sapply(salary, sacrifice) / salary, 2)
salary <- 1000 * salary
my_table <- data.frame(salary, percent_lost)
That’s the code for making a little table, showing the same numbers as those in the above graph.
Here is the resulting table:
salary    %
 10000 4.68 -- I started the table at £10k for no good reason
 11000 4.68
 ...
 41000 4.68
 42000 4.68 -- the proposed new threshold
 43000 4.72
 44000 4.76
 45000 4.79
 46000 4.82
 47000 4.86
 48000 4.89
 49000 4.92
 50000 4.94
 51000 4.97
 52000 5.00
 53000 5.02
 54000 5.05
 55000 5.07
 55550 5.08 -- current USS threshold, highest % of salary lost
 56000 5.05
 57000 4.98
 58000 4.91
 59000 4.84
 60000 4.78
 61000 4.72
 62000 4.66
 63000 4.60
 64000 4.54
 65000 4.49
 66000 4.44
 67000 4.39
 68000 4.34
 69000 4.29
 70000 4.24
 71000 4.19
 72000 4.15
 73000 4.11
 74000 4.07
 75000 4.02
 76000 3.98
 77000 3.95
 78000 3.91
 79000 3.87
 80000 3.84
 81000 3.80
 82000 3.77
 83000 3.73
 84000 3.70
 85000 3.67
 86000 3.64
 87000 3.61
 88000 3.58
 89000 3.55
 90000 3.52
 91000 3.49
 92000 3.47
 93000 3.44
 94000 3.41
 95000 3.39
 96000 3.36
 97000 3.34
 98000 3.31
 99000 3.29
100000 3.27
150000 2.51 -- possibly there are even some salaries this high?!
Appendix 2: Details of the update made on 14 March
Many thanks to all who gave feedback on the original posting, yesterday (13 March).
In response to that feedback, I made two substantive changes to the calculation. This Appendix gives details of those changes, for those who are interested (and for the record).
Neither change affects the story qualitatively: only the detailed numbers have changed a bit.
Change 1: Use of HMRC multiplier 19 rather than 23
The HMRC calculations for Annual Allowance and Lifetime Allowance purposes are different in detail: the former uses a multiplier of 19 times pension to value USS defined benefits, while the latter uses 23 (i.e., in place of 19). In yesterday’s post I had used 23. The updated figures calculated above use multiplier 19 **instead.**
Mainly I decided to use the smaller figure as it’s a bit more conservative, in relation to the value lost through the proposed reduction of defined benefits. (I certainly don’t want to be accused of bias in the other direction, through having picked the larger multiplier.)
The effect on the calculated numbers is mainly to reduce the height of the “spike” that appears in the graph, around the £55k salary level. The spike is still there; it’s just a bit smaller.
My friend Jon commented that the actual value of a defined-benefit pension is harder to quantify than the HMRC formula would suggest — and that it’s likely to be dependent on age and perhaps other factors. This is undoubtedly true, and certainly I would not suggest that anyone should use the above numbers for their own financial planning! Rather, the aim here was (only) to show through a simple, transparent calculation how the losses arising from current proposals would differ — in rough, average terms — between pay levels.
Since writing my post yesterday I found that I am not alone in having done a calculation like this: see also http://brianosmith.blogspot.co.uk/ (and maybe there are others too?).
Change 2: Inclusion of the USS “Match” at all salary levels
Several people pointed out to me that the USS “Match” possibility is available at all salary levels. So it’s a benefit that would be lost at all salary levels, under the 12 March agreement. In yesterday’s post I had taken it into account only at salaries over £55.55k: that (relatively minor) error is now corrected, in the revised figures shown above.