
RAE 2008: How much weight did research outputs actually get?
In the 2008 UK Research Assessment Exercise each subject-area assessment panel specified and published in advance the weight to be given to each of the three parts of the assessment, namely “research outputs”, “research environment” and “esteem”. The quality “sub-profiles” for those three parts were then combined into an overall quality profile for each department assesed, by using the published weights. The overall quality profiles have since been used in HEFCE funding allocations, and in various league tables published by newspapers and others.
For example, RAE Panel F (Pure and Applied Maths, Statistics, Operational Research, Computer Science and Informatics) specified the following weights:
- Research outputs: 70%
- Research environment: 20%
- Esteem: 10%
The weight specified for research outputs varied between 50% (for RAE Panel G, engineering disciplines) to 80% (RAE Panel N, humanities disciplines).
When the RAE sub-profiles were published in spring 2009, it became clear that the assessments for the three parts were often quite different from one another. For example, some of the assessment panels awarded many more 4* (“world leading”) grades for research environment and esteem than for research outputs. These seemingly systematic differences naturally prompt the question: to what extent are the agreed and published weights for the three parts reflected in funding allocations, league tables, etc.?
Let’s leave the consideration of league tables for another time. Here we’ll calculate the actual relative weights of the three parts in terms of their effect on funding outcomes, and compare those with the weights that were published and used by RAE assessment panels.
The formula used by HEFCE in 2009 awarded quality-related research funding to departments in proportion to
\[7 p_{4d} + 3 p_{3d} + p_{2d}\]where the p’s come from the department’s overall RAE profile (being the percentages at quality levels 4, 3 and 2*). Now, from the published sub-profile for research outputs, it can also be calculated how much of the any department’s allocated funding came from the research outputs component, in the obvious way. The actual weight accorded to research outputs in the 2009 funding outcomes by a given RAE Sub-panel is then
\[{\sum_d(\textrm{funding from RAE research outputs profile for department } d) \over\sum_d(\textrm{funding from overall RAE profile for department } d)}\]where the summations are over all of the departments d assessed by the Sub-panel. (In the calculation here I have used the un-rounded overall profiles, not the crudely rounded ones used by HEFCE in their 2009 funding allocation. I’ll write more about that in a later post. Rounded or un-rounded doesn’t really affect the main point here, though.)
For 2010 it seems that the HEFCE funding rates will be in the ratio 9:3:1 rather than 7:3:1, i.e., proportionately more funds will be given to departments with a high percentage of work assessed at the 4* quality level. The table below lists the discrepancies between the actual and intended weight given to Outputs, by RAE Sub-panel, using the 2009 and 2010 HEFCE funding rates. For example, the RAE Sub-panel J41 (Sociology) decided that 75% of the weight should go to Outputs, but the reality in 2009 was that only 56.6% of the HEFCE “QR” funding to Sociology departments came via their Outputs sub-profiles; the corresponding figure that appears in the table below is 56.6 - 75 = -18.4. An alternative view of the same numbers is that the Sociology Sub-panel intended to give combined weight 25% to “research environment” and “esteem”, but those two parts of the assessment actually accounted for a very much larger 43.4% of the 2009 funding allocation to Sociology departments (and with the new funding rates for 2010 that will increase to 45.4%).
| RAE Panel | RAE Sub-panel name | 2009 | 2010 |
| A | Cardiovascular Medicine | -2.9 | -3.4 |
| A | Cancer Studies | -3.8 | -4.3 |
| A | Infection and Immunology | -7.7 | -9.0 |
| A | Other Hospital Based Clinical Subjects | -13.4 | -16.1 |
| A | Other Laboratory Based Clinical Subjects | -4.5 | -4.9 |
| B | Epidemiology and Public Health | -10.7 | -12.5 |
| B | Health Services Research | -9.2 | -10.6 |
| B | Primary Care and Other Community Based Clinical Subjects | -5.0 | -5.4 |
| B | Psychiatry, Neuroscience and Clinical Psychology | -6.4 | -7.2 |
| C | Dentistry | 0.2 | -0.5 |
| C | Nursing and Midwifery | -2.3 | -3.6 |
| C | Allied Health Professions and Studies | -1.9 | -2.5 |
| C | Pharmacy | -4.1 | -5.3 |
| D | Biological Sciences | -5.5 | -6.0 |
| D | Pre-clinical and Human Biological Sciences | -4.9 | -5.6 |
| D | Agriculture, Veterinary and Food Science | -7.0 | -8.2 |
| E | Earth Systems and Environmental Sciences | -4.9 | -5.6 |
| E | Chemistry | -3.5 | -3.9 |
| E | Physics | -3.2 | -4.1 |
| F | Pure Mathematics | -3.8 | -4.2 |
| F | Applied Mathematics | -6.0 | -7.2 |
| F | Statistics and Operational Research | -3.2 | -3.5 |
| F | Computer Science and Informatics | 1.8 | 1.6 |
| G | Electrical and Electronic Engineering | 2.0 | 1.8 |
| G | General Engineering and Mineral & Mining Engineering | 3.2 | 2.7 |
| G | Chemical Engineering | 7.1 | 7.8 |
| G | Civil Engineering | 1.2 | 0.6 |
| G | Mechanical, Aeronautical and Manufacturing Engineering | 3.7 | 3.7 |
| G | Metallurgy and Materials | 2.6 | 2.2 |
| H | Architecture and the Built Environment | -2.8 | -3.7 |
| H | Town and Country Planning | -3.2 | -3.3 |
| H | Geography and Environmental Studies | -3.8 | -4.5 |
| H | Archaeology | -10.9 | -12.6 |
| I | Economics and Econometrics | -1.2 | -1.1 |
| I | Accounting and Finance | -4.0 | -4.7 |
| I | Business and Management Studies | -5.3 | -6.2 |
| I | Library and Information Management | -8.9 | -10.0 |
| J | Law | -13.4 | -14.7 |
| J | Politics and International Studies | -9.6 | -10.0 |
| J | Social Work and Social Policy & Administration | -8.4 | -9.7 |
| J | Sociology | -18.4 | -20.4 |
| J | Anthropology | -18.6 | -21.2 |
| J | Development Studies | -11.5 | -12.9 |
| K | Psychology | -3.6 | -4.6 |
| K | Education | -5.9 | -7.5 |
| K | Sports-Related Studies | -4.5 | -5.5 |
| L | American Studies and Anglophone Area Studies | -13.3 | -14.7 |
| L | Middle Eastern and African Studies | -14.3 | -16.0 |
| L | Asian Studies | -14.1 | -15.5 |
| L | European Studies | -11.1 | -13.1 |
| M | Russian, Slavonic and East European Languages | -11.1 | -12.8 |
| M | French | -6.9 | -7.6 |
| M | German, Dutch and Scandinavian Languages | -4.5 | -5.3 |
| M | Italian | -8.6 | -9.7 |
| M | Iberian and Latin American Languages | -12.2 | -13.8 |
| M | Celtic Studies | -9.8 | -11.3 |
| M | English Language and Literature | -10.9 | -12.7 |
| M | Linguistics | -7.9 | -9.1 |
| N | Classics, Ancient History, Byzantine and Modern Greek Studies | -8.8 | -10.1 |
| N | Philosophy | -11.9 | -14.1 |
| N | Theology, Divinity and Religious Studies | -9.6 | -11.4 |
| N | History | -8.4 | -9.5 |
| O | Art and Design | -13.9 | -14.8 |
| O | History of Art, Architecture and Design | -1.0 | -1.0 |
| O | Drama, Dance and Performing Arts | -2.8 | -2.9 |
| O | Communication, Cultural and Media Studies | 0.7 | 0.8 |
| O | Music | -4.5 | -4.6 |
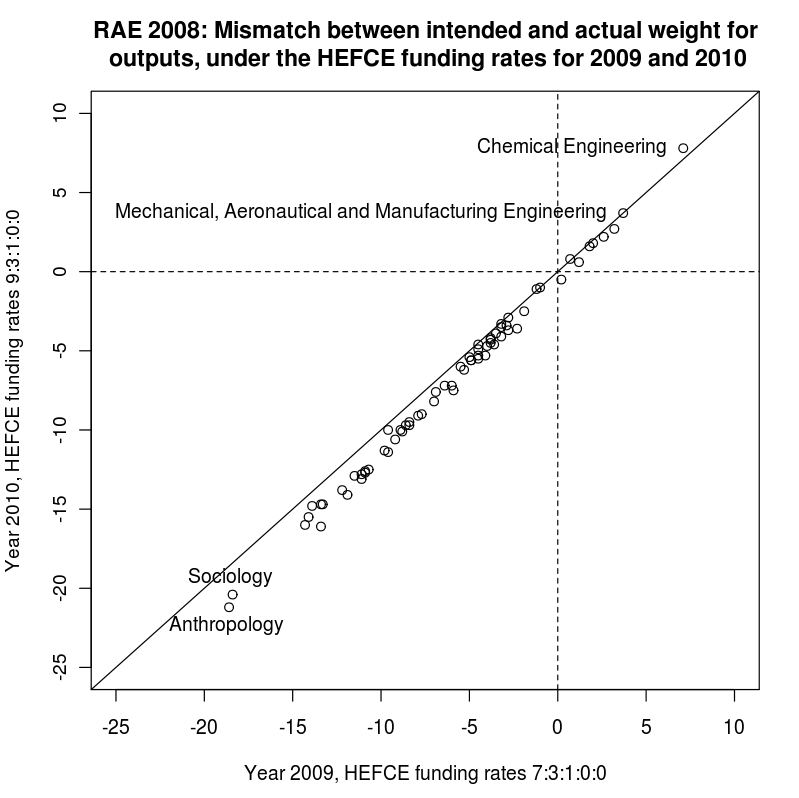
Most of the discrepancies are negative: the actual weight given to research outputs, in terms of funding, is less than was apparently intended by most of the assessment panels. Some of the discrepancies are very large indeed — more than 20 percentage points in the cases of Sociology and Anthropology, under the HEFCE funding rates that will be applied in 2010.
Click on the image for a graphical view of the relationship between the discrepancies for 2009 (funding rates 7:3:1:0:0 for the five RAE quality levels) and 2010 (funding rates 9:3:1:0:0).
\begin{opinion}
In RAE 2008 the agreed and published weights were the result of much discussion and public consultation, most of which centred on the perceived relative importance of the three components (research outputs, research environment, esteem) in different research disciplines. The discrepancies that are evident here arise from the weighted averaging of three separate profiles without (it seems) careful consideration of the differences of distribution between them. In the case of funding, it’s (mainly) differences in the usage of the 4* quality level that matter: if 4* is a relatively rare assessment for research outputs but is much more common for research environment, for example, the upshot is that the quality of research outputs actually determines less of the funding than the published weights would imply.
It is to be hoped that measures will be put in place to rectify this in the forthcoming replacement for the RAE, the Research Excellence Framework. In particular, the much-debated weight of 25% for the proposed new “impact” part of the REF assessment might actually turn out to be appreciably more if we’re not careful (the example of Sociology, see above, should be enough to emphasise this point).
\end{opinion}
Acknowledgement
The calculation done here was suggested to me by my friend Bernard Silverman, and indeed he did the same calculation independently himself (for the 2009 funding formula) and got the same results. The opinion expressed above is mine, not necessarily shared by Bernard.
© David Firth, February 2010
To cite this entry:
Firth, D (2010). RAE 2008: How much weight did research outputs actually get? Weblog entry at https://DavidFirth.github.io/blog/2010/02/07/rae-how/.