
RAE 2008: Assessed quality of research in different disciplines
I had the pleasure of being a member of one of the assessment sub-panels for RAE 2008, the “Research Assessment Exercise” for UK universities. I’m going to start things off here by posting a few bits and pieces of simple data analysis related to that. (It should be stressed that all of the data used here are in the public domain; none of what appears here is privileged information arising from my RAE panel membership.)
After that, who knows what else?
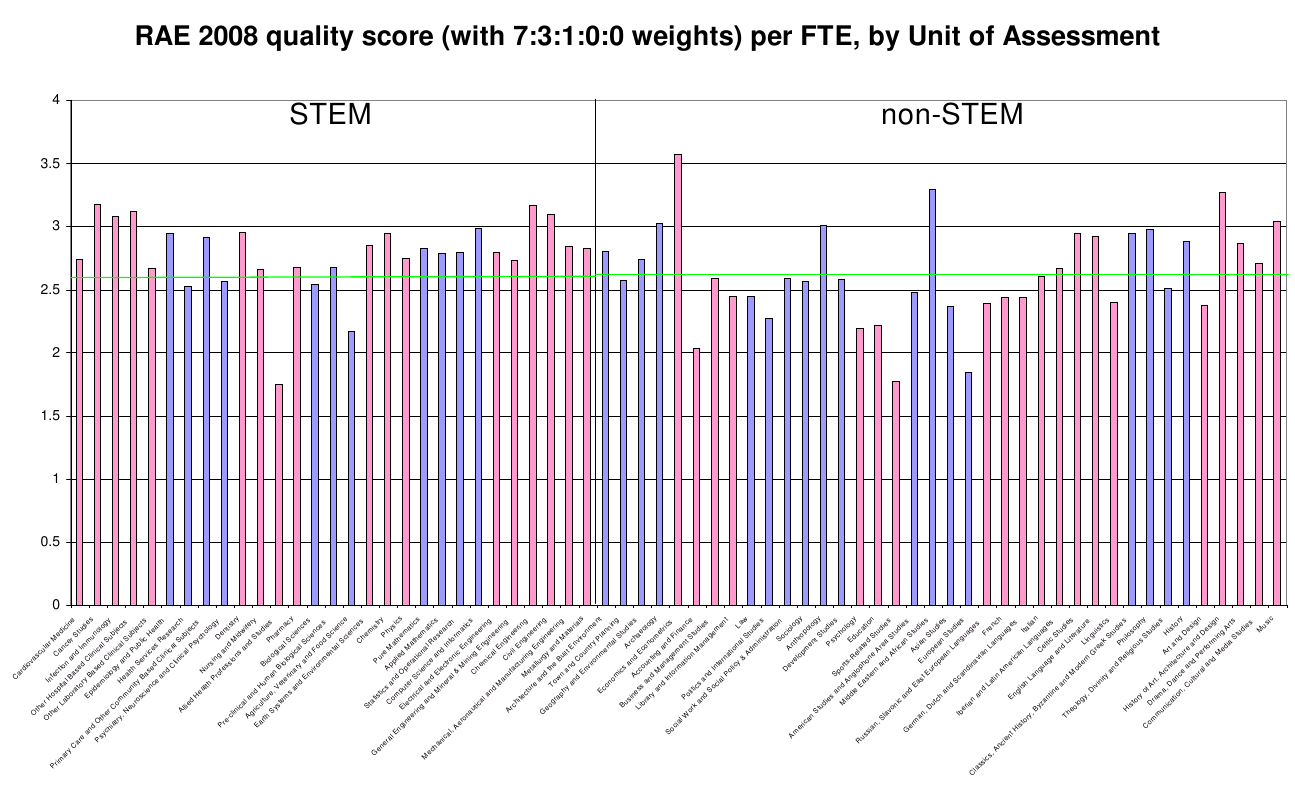
This graph was drawn with the help of my daughter Kathryn on her “take your daughter to work” day in Year 10 at school. Her skill with spreadsheet programs was invaluable!
The graph shows how different disciplines — that is, different RAE “sub-panels” or “units of assessment” — emerged in terms of their average research quality as assessed in RAE 2008. The main data used to make the graph are the overall (rounded) quality profiles and submission-size data that were published in December 2008. Those published quality profiles were the basis (in March 2009) of ‘QR’ funding allocations made for 2009-10 by HEFCE to universities and other institutions.
Each bar in the graph represents one academic discipline (as defined by the remit of an RAE sub-panel). The blue and pink colouring shows how the sub-panels were organised into 15 RAE “main panels”. A key task of the main panels was to try to ensure comparability between the assessmenta made for different disciplines. Disciplines within the first seven main panels are the so-called “STEM” (Science, Technology, Engineering and Mathematics) subjects.
The height of each bar is calculated as the average, over all “full-time equivalent” (FTE) researchers whose work was submitted to the RAE, of a “quality score” calculated directly from the published RAE profile of each researcher’s department. The quality score for members of department d is calculated as a weighted sum
\[w_4 p_{4d} + w_3 p_{3d} + w_2 p_{2d} + w_1 p_{1d} + w_0 p_{0d}\ ,\]where the p’s represent the department’s RAE profile and the w’s are suitably defined weights (with \(w_4 \ge w_3 \ge \ldots \ge w_0\)). The particular weights used in constructing such a quality score are rather arbitrary; here I have used 7:3:1:0:0, the same weights that were used in HEFCE’s 2009 funding allocation, but it would not make very much difference, for the purpose of drawing this graph to compare whole disciplines, to use something else such as 4:3:2:1:0.
Example: for a department whose RAE profile is
          4*   3*   2*   1*   0*
          0.10 0.25 0.30 0.30 0.05
the quality score assigned to each submitted researcher is
\[(7 \times 0.10) + (3\times 0.25) + (1 \times 0.30) = 1.75\ .\]The average quality score over the whole RAE was about 2.6 (the green line in the graph).
The graph shows a fair amount of variation between disciplines, both within and between main panels of the RAE. The differences may of course reflect, at least to some extent, genuine differences in the perceived quality of research in different disciplines; the top-level RAE assessment criteria were the same for all disciplines, so in principle this kind of comparison between disciplines might be made (although in practice the verbally described criteria would surely be interpreted differently by assessors in different disciplines). However, it does appear that some main panels were appreciably tougher in their assessments than others. Even within main panels it looks as though the assessments of different sub-panels might not really be comparable. (On this last point, main panel F even went so far as to make an explicit comment in the minutes of its final meeting in October 2008 (available in this zip file from the RAE website): noting the discrepancy between assessments for Computer Science and Informatics and for the other three disciplines under its remit, Panel F minuted that ”…this discrepancy should not be taken to be an indication of the relative strengths of the subfields in the institutions where comparisons are possible.” I have not checked the minutes of other panels for similar statements.)
Note that, although the HEFCE funding weights were used in constructing the scores that are summarized here, the relative funding rates for different disciplines cannot be read straightforwardly from the above graph. This is because HEFCE took special measures to protect the research funding to disciplines in the “STEM” group. Within the non-STEM group of disciplines, relative heights in the above graph equate to relative funding rates; the same applies also within each main panel among the STEM disciplines. (On this last point, and in relation to the discrepancy minuted by Panel F as mentioned above: Panel F also formally minuted its hope that the discrepancy would not adversely affect the QR funding allocated to Pure Maths, Applied Maths, and Statistics & Operational Research. But, perhaps unsurprisingly, that expression of hope from Panel F was ignored in the actual funding formula!)
\begin{opinion}
HEFCE relies heavily on the notion that assessment panels are able to regulate each other’s behaviour, so as to arrive at assessments which allow disciplines to be compared (for funding purposes at least, and perhaps for other purposes as well). This strikes me as wishful thinking, at best! By allowing the relative funding of different disciplines funding to follow quality scores so directly, HEFCE has created a simple game in which the clear incentive for the assessors in any given discipline is to make their own scores as high as they can get away with. The most successful assessment panel, certainly in the eyes of their own colleagues, is not the one that makes the best job of assessing quality faithfully, but the one with the highest scores at the end! This seems an absurd way to set up such an expensive, and potentially valuable, research assessment exercise. Unfortunately in the current plans for the REF (Research Excellence Framework, the RAE’s successor) there is little or no evidence that HEFCE has a solution to this problem. The REF pilot study seems to have concluded, as perhaps expected, that routinely generated “bibliometric” measures cannot be used at all reliably for such inter-discipline comparisons.
Since I don’t have an alternative solution to offer, I strongly favour the de-coupling of allocation of funds between disciplines from research quality assessment. If the Government or HEFCE wishes or needs to increase its funding for research in some disciplines at the expense of others, it ought to be for a good and clear reason; research assessment panels will inevitably vary in their interpretation of the assessment criteria and in their scrupulousness, and such variation should not be any part of the reason.
\end{opinion}
© David Firth, November 2009
To cite this entry:
Firth, D (2009). RAE 2008: Assessed quality of research in different disciplines. Weblog entry at URL https://DavidFirth.github.io/blog/2009/11/25/rae-2008-assessed/.